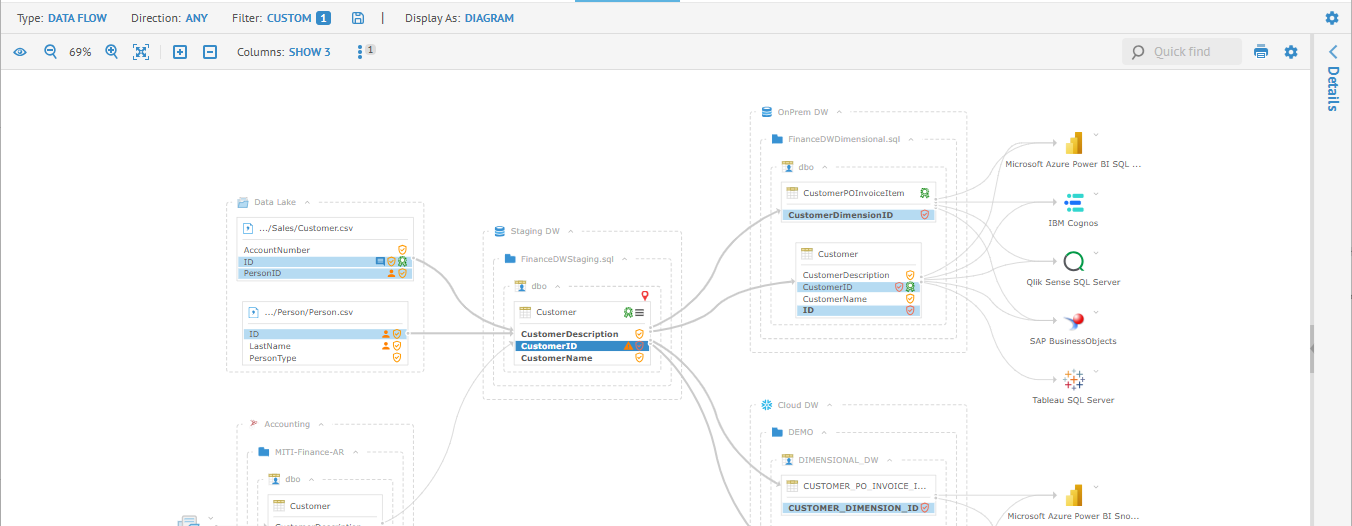

The data flow "interactive" Analysis Diagram displays the columns/fields involved in the given data flow trace, not all the columns. The user can then select the columns/fields to be displayed to better present the business use case of that data flow. Then the user can interact within that diagram by selecting columns/fields to display its lineage. Furthermore, the Analysis Diagrams allow you to display conditional labels such as PII or Confidential Sensitivity Level, not only providing more critical information to the user, but also better visualization of the propagation of that information (e.g. PII) through the data flow lineage trace.
Please refer to the diagram visualization common features.
In addition to those general features, additionally there features specific to the classic diagram presentation.
In order to see data flow lineage, one must
o Define a configuration that contains all of the models potentially in the data flow
o Stitch the models together by resolving connection definitions and Build the configuration
Once the configuration is ready, then you are ready to report on lineage.
End-to-end data flow lineage across models is only available at the classifier (e.g., table) and feature (e.g., column) level. If instead, one goes to the object page for a schema or model, , as this is not classifier or feature, the data flow tab shows the overview lineage within the scope of that model only.
Steps
2. Click the Analysis Diagram tab on the left side.
3. From here you may
o Pick the Direction in the pull-down in the header of the diagram:
- Impact (Destination) direction
- Lineage (Sources) direction
- Any type for both data impact and lineage.
o Select which columns to display in the diagram using the Columns pull-down in the header of the diagram.
- A list of possible columns with a quick find is presented with checkboxes.
o Pick the Depth in the pull-down in the upper right.
- 1 (Adjacent) step in the lineage. Objects in the lineage that are the next items in a lineage trace.
For impact, adjacent can often be the data store (like a warehouse) that is the target of an object being loaded by DI/ETL that is the focus of the lineage. For course lineage, it can often mean the data source directly loaded from to produce the object that is the focus of the lineage.
- 2 thru 9 steps in the lineage
- Any type for both data impact and lineage.
o Click the Show actions for the selected object icon and
- Select Show/Hide Columns to show columns in the selected object, or all objects if none is selected.
- Select Expand/Collapse All to expand the display of the selected object down to the current display level (columns or tables) or collapse to the highest level. Applies to all objects if none is selected.
o Click Save an image to produce a downloadable file with a lineage image.
o Click Filters and specify lineage filter options.
o Click Display Options and specify lineage display options.
Example
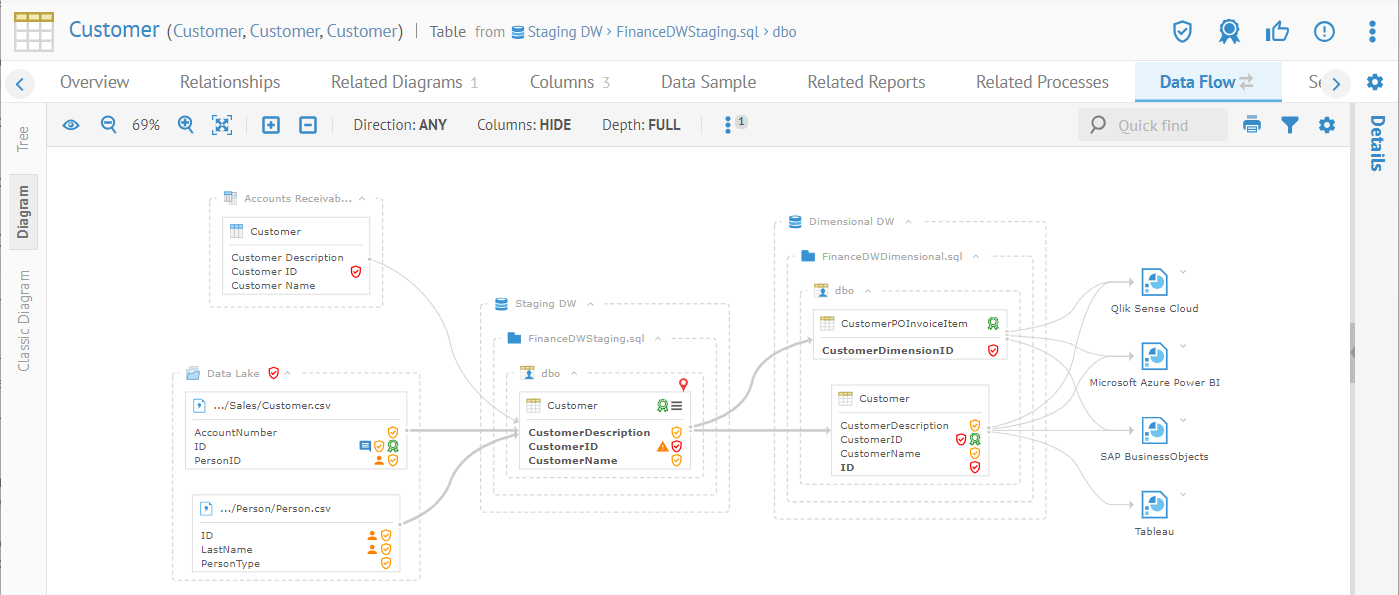
Navigate to the object page for the Customer table in the Staging DW.dbo schema.
Go to the Data Flow tab and click the Diagram tab on the left side.
Pick ANY for the Direction in the pull-down in the diagram header.
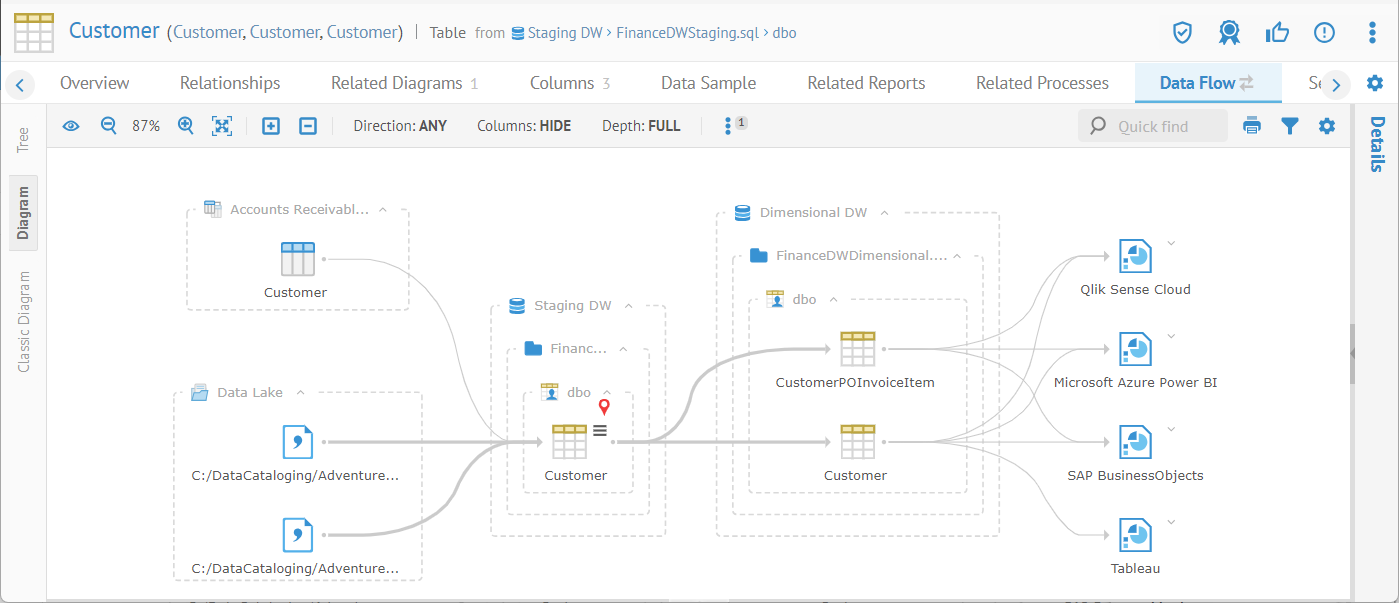
The red colored pin indicating the source of the lineage and impact trace.
The diagram defaults to the classifier (table) level for performance reasons.
Click the Show actions for the selected object icon and select Show Columns.
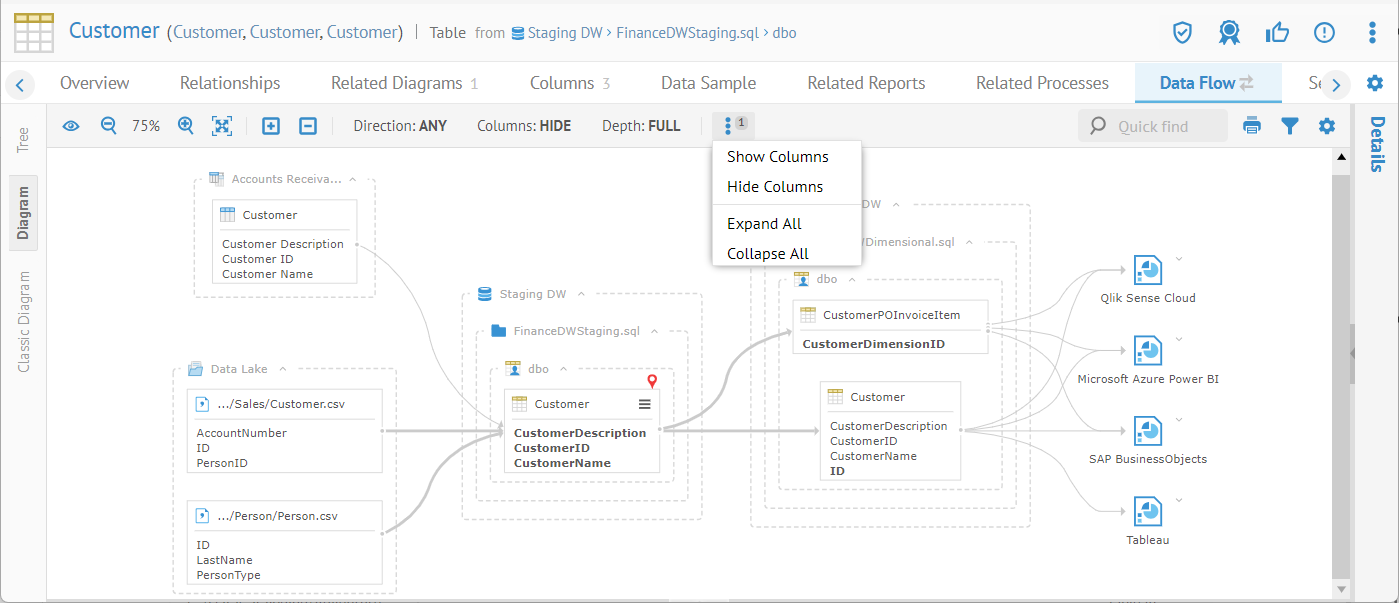
Now columns are visible, but still not the column lines. Again, this is for reasons of performance and simplicity of presentation.
Click on the Display Options icon and click Show Conditional Labels
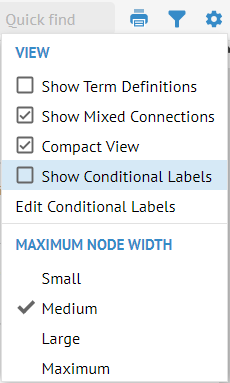
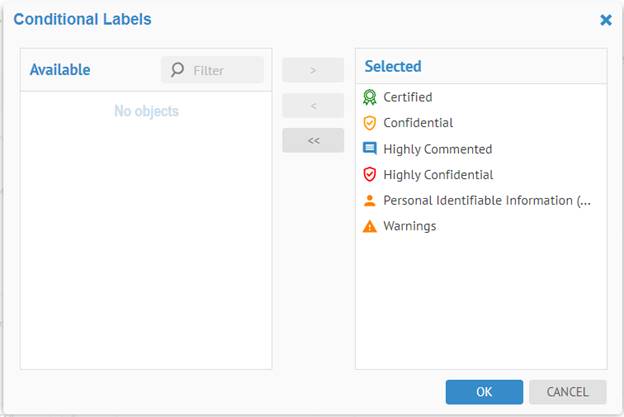
Here, you may pick and choose conditional labels to show in the diagram and the image shows all of them selected for display.
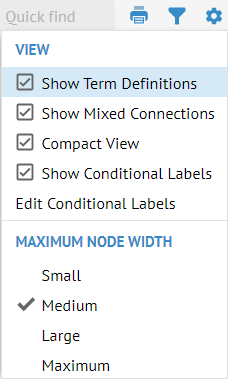
Click on the Display Options icon and select Show Term Definitions
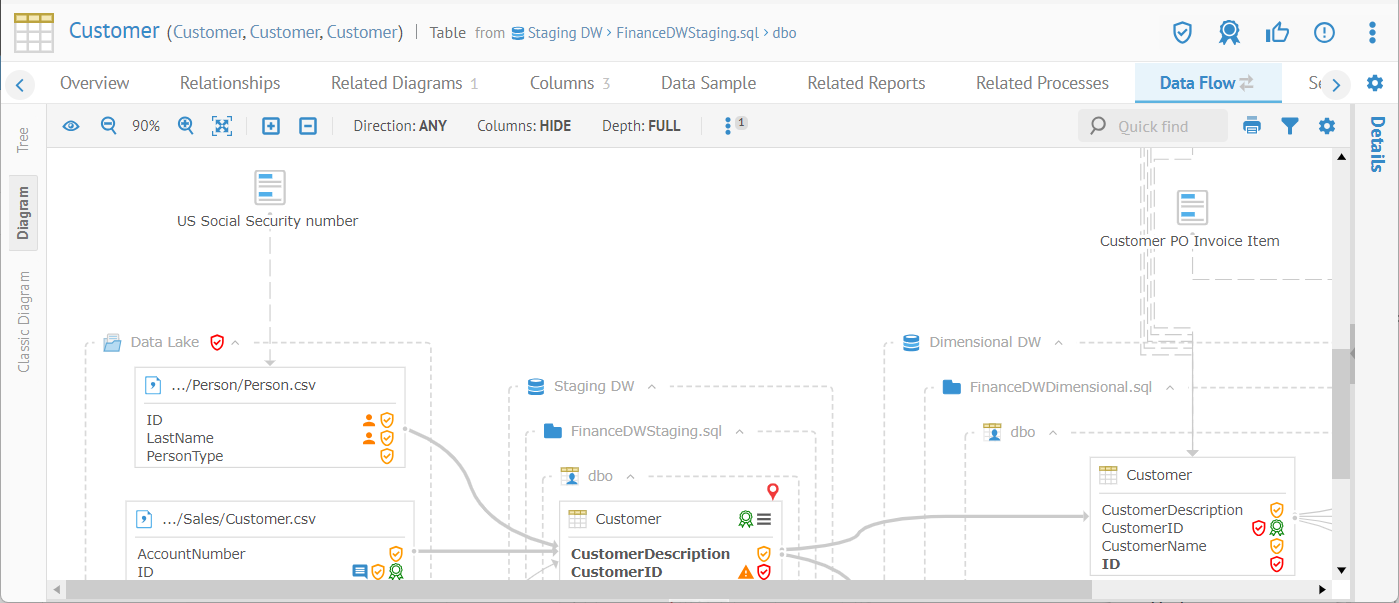
Terms, like US Social Security Number (documenting the ID field), are used to document columns and tables that are in this lineage trace and this is shown in the diagram.
Lineage Diagram Visualization Common Features
There are a number of common features and tools available when visualizing a lineage trace, data model, etc.
Lineage Diagram Show Overview
You may click this Show overview icon to show or hide an Overview panel of the model diagram. Click in the overview to quickly move to a portion of the full diagram.
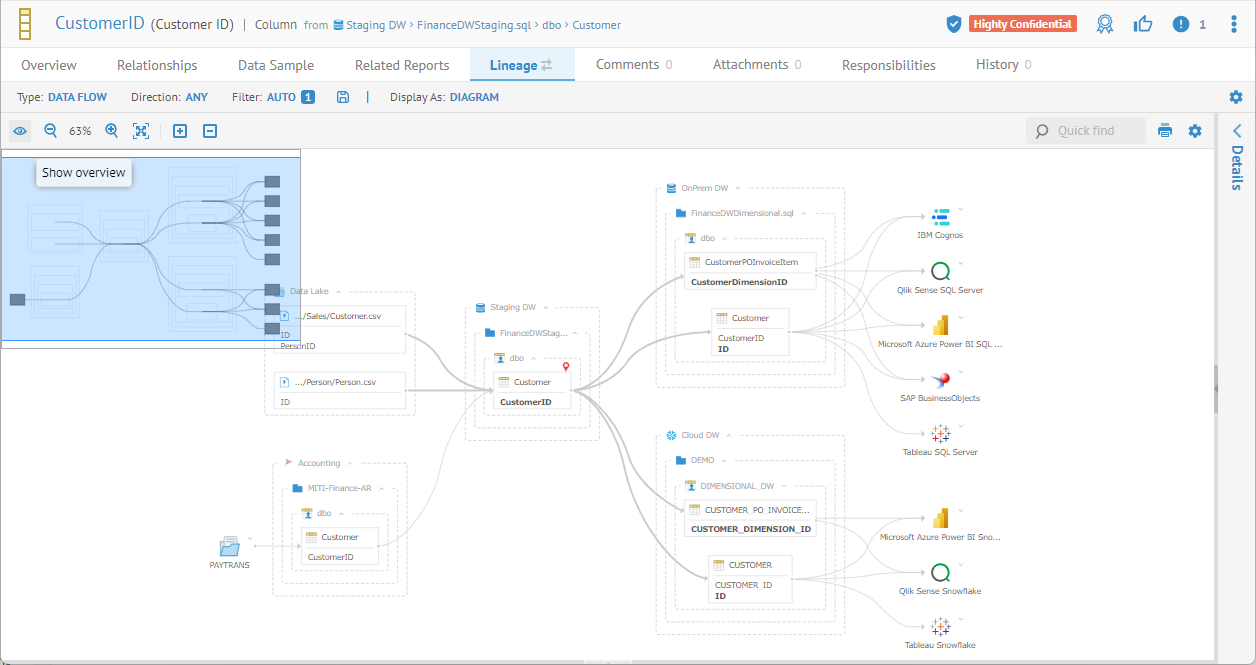
Lineage Diagram Zoom In/Out and Fit to content
Click Zoom in () or Zoom out
() icons to adjust the aspect ratio of
the diagram. Also, you may click on the Fit to
content ( )icon to view
the entire diagram at the best zoom that will fit.
Lineage Diagram Collapse / Expand

Click Expand / Collapse to expand or collapse the entire diagram (ensure that you do not have an object selected, otherwise the action will only apply to that object).
You may also click on the plus sign for an object to expand and the minus sign to collapse just that object.
Lineage Diagram Show/Hide Columns
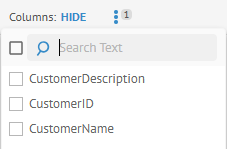
You may show or hide all columns or show specific ones.
In order for this option to be available, you must have specified Yes for COLUMN FLOW in the Data Flow Options menu.
Lineage Diagram Show actions for the selected object
Show the actions available in the context menu for the selected object.

o Open to go to the object page for the object
o Open Lineage to change the point of origin (red pin in diagram) to present a new lineage display.
Lineage Diagram Trace in General
Select the Analysis Diagram tab on the left to obtain this presentation. You will see a graphical presentation of the lineage (data impact or data source).
Additional options include:
Overview
You may click this icon to show or hide an Overview panel of the lineage trace diagram. Click in the overview to quickly move to a portion of the full diagram.
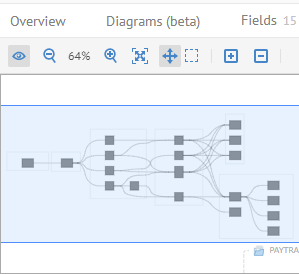
Zoom In/Out and Fit to content
Click Zoom in or Zoom out icons to adjust the aspect ratio of the diagram. Also, you may click on the Fit to content icon to view the entire diagram at the best zoom that will fit.

Collapse / Expand

Click Expand / Collapse to expand or collapse the entire diagram (ensure that you do not have an object selected, otherwise the action will only apply to that object).
You may also click on the plus sign for an object to expand and the minus sign to collapse just that object.
Open the object page

You may right-click and select Open
( ),to navigate to the object
page.

You may download a PNG or SVG image of the diagram.
Quick find

In the upper right, there is a search text box that will provide a quick list of object names that contain the text you type. You may click on any of the results to select that object in the diagram and moving the focus there.
Explore Further
Invoking a lineage trace from any reference to an object
You may invoke a lineage trace from any diagram or any list of results (e.g., from a Browse or Search), either via right-click context menu
In the CLASSIC DIAGRAM
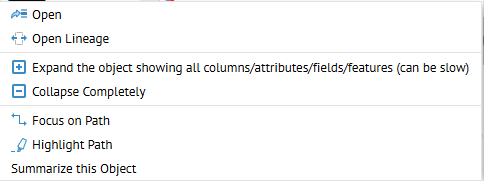
In the DIAGRAM

Interpreting the graphical lineage
In general, the lineage tools within MetaKarta function identically whether one is analyzing data flow lineage, semantic lineage or both. However, the presentation is different, as follows:
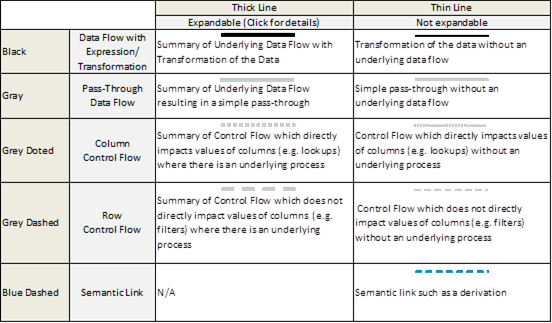
In addition, MetaKarta has four levels of presentation:
o Configuration Model Connections Overview – which is a diagram representing the various Models contained within a configuration and how they are related (or stitched) to each other based upon connection definitions manually assigned to MetaKarta.
o Model Connections Overview – which is a diagram representing the various Models contained within the directory of an external repository and how they are related (or stitched) to each other based upon connection definitions already provided in the external metadata repository.
o Model Lineage Overview – which is a diagram representing an overview of the lineage within a given Model.
o Lineage Trace analysis at the configuration or Model level – which is a fully detailed trace of semantic and/or data flow lineage for detailed analysis.
Properties Panel
Click to select a object and view its properties in the Properties Panel on the right. You may show and hide this panel as needed.
The  Display Options are available.
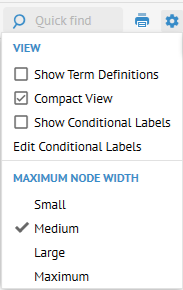
o Show Term Definitions – Show semantic lineage back to glossary terms for those which provide definitions of objects in the data flow lineage
o Compact View – Toggles between small boxes with icons and wider boxes with more text and detail.
o Show Conditional Labels – Display conditional labels in the diagram as selected in Edit Conditional Labels.
o Edit Conditional Labels – Pick the conditional labels to display
o MAXIMUM NODE WIDTH – set the size of the object boxes.
Lineage Diagram Options Show Term Definitions
Here you may see the terms with Defined by relationships in the diagram.
Lineage Diagram Options Compact View
Lineage Diagram Options Show Conditional Labels
Click on the Display Options icon and click Show Conditional Labels


Here, you may pick and choose conditional labels to show in the diagram and the image shows all of them selected for display.

Lineage Diagram Options Show Mixed Connections
Sometimes an ETL/DI process will read from one table and write to another table in the same database. In this case, the lineage will often show process arrows that loop back because the normal presentation is to group tables inside their respective schemas. However, by default, the lineage in the Data Flow tab will attempt to produce a continuous diagram from left to right through the lineage by breaking up these tables giving a more understandable lineage picture.

When you click this checkbox the lineage is returned to the mode where all tables are grouped into their respective schemas and thus loops are shown.
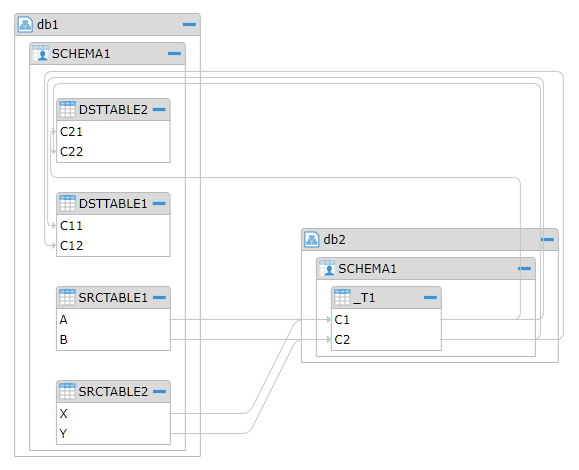
Steps
The default setting where this option is not checked is presented.
2. Check
 Display Options >
Show Mixed Connections to show these objects
The lineage is returned to the mode where all tables are grouped into their respective schemas and thus loops are shown
3. You may uncheck to return to the default.
4. Then select Show Mixed Connections from the Display Options menu.
Example
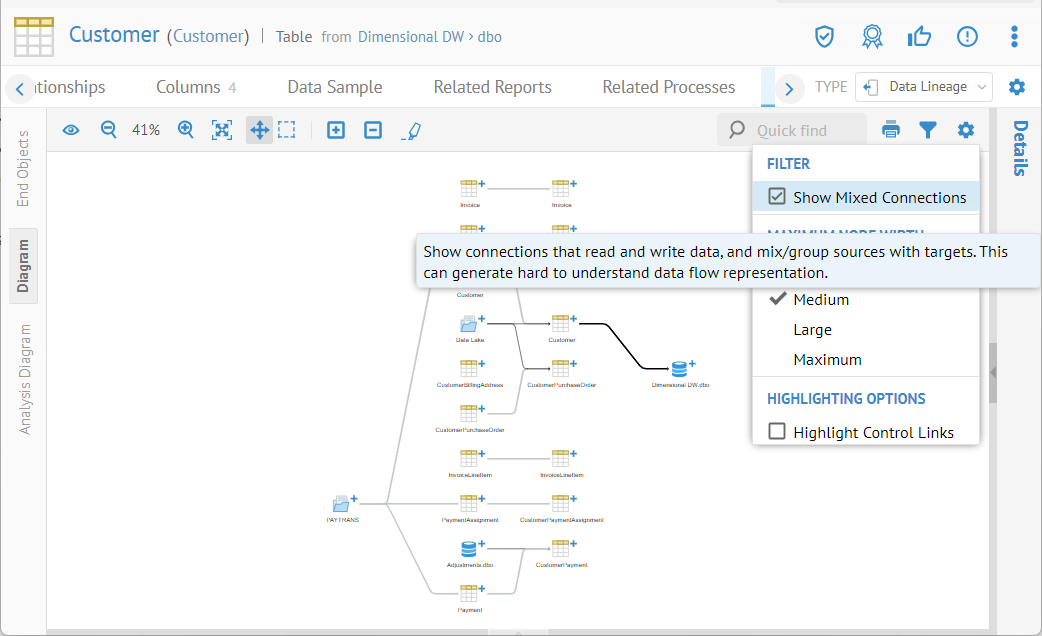
Expand Staging DW.dbo.CustomerPayment and select PaymentID.
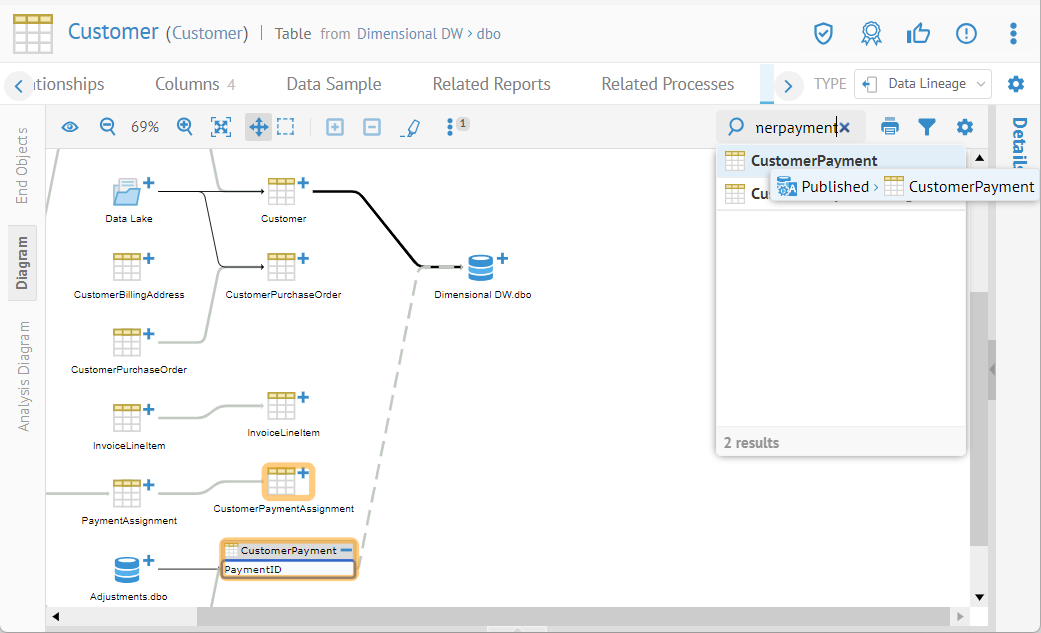
Many new objects, which are not directly connected by data flow links now appear. Selecting Data Flow Settings >Control Flow > Complete shows any objects which are connected via control flow to the origin object and any subsequent objects.
Lineage Diagram Options Maximum Node Width
In many cases, names of objects may be too long to fit into the objects in the diagram. You may specify several different node width maximums to make the diagram more readable. Click on Display Options.
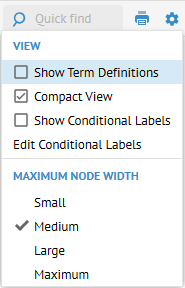
Pick the note width.